
Page 70 - KCMO Parks Master Plan 2032
P. 70
RECREATION &
RECREA TION &
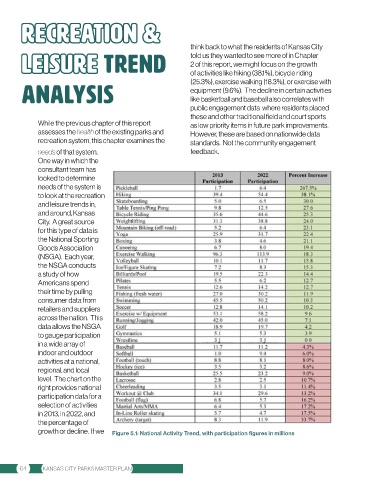
think back to what the residents of Kansas City
LEISURE
LEISURE TREND told us they wanted to see more of in Chapter
2 of this report, we might focus on the growth
of activities like hiking (38.1%), bicycle riding
(25.3%), exercise walking (18.3%), or exercise with
ANALYSIS equipment (9.6%). The decline in certain activities
like basketball and baseball also correlates with
public engagement data where residents placed
these and other traditional field and court sports
While the previous chapter of this report as low priority items in future park improvements.
assesses the health of the existing parks and However, these are based on nationwide data
recreation system, this chapter examines the standards. Not the community engagement
needs of that system. feedback.
One way in which the
consultant team has
looked to determine
needs of the system is
to look at the recreation
and leisure trends in,
and around, Kansas
City. A great source
for this type of data is
the National Sporting
Goods Association
(NSGA). Each year,
the NSGA conducts
a study of how
Americans spend
their time by pulling
consumer data from
retailers and suppliers
across the nation. This
data allows the NSGA
to gauge participation
in a wide array of
indoor and outdoor
activities at a national,
regional, and local
level. The chart on the
right provides national
participation data for a
selection of activities
in 2013, in 2022, and
the percentage of
growth or decline. If we Figure 5.1: National Activity Trend, with participation figures in millions
64 KANSAS CITY PARKS MASTER PLAN