
Page 26 - KCMO Parks Master Plan 2032
P. 26
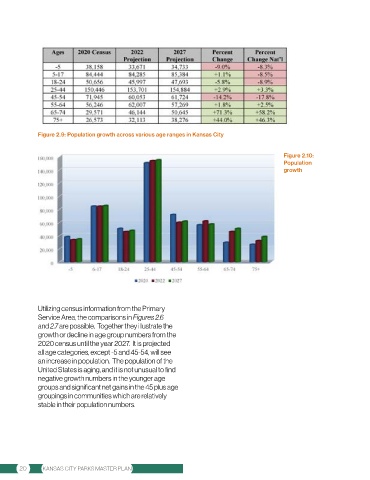
Figure 2.9: Population growth across various age ranges in Kansas City


                                                                                               Figure 2.10:
                                                                                               Population
                                                                                               growth


              Utilizing census information from the Primary
              Service Area, the comparisons in Figures 2.6
              and 2.7 are possible.  Together they illustrate the
              growth or decline in age group numbers from the
              2020 census until the year 2027.  It is projected
              all age categories, except -5 and 45-54, will see
              an increase in population.  The population of the
              United States is aging, and it is not unusual to find
              negative growth numbers in the younger age
              groups and significant net gains in the 45 plus age
              groupings in communities which are relatively
              stable in their population numbers.


        20     KANSAS CITY PARKS MASTER PLAN