
Page 28 - KCMO Parks Master Plan 2032
P. 28
RECREATION
MARKET
PROFILE
MARKET PROFILE
Beyond median age and income, examining a significant consistency is observed among
household budget expenditures is crucial. median household income, household budget
Analyzing average household spending on items expenditures, and recreation spending potential.
like shelter, utilities, fuel, public services, and
entertainment offers insight into the cost of living Based on data from the National Sporting Goods
and spending habits in the service areas. Figure Association’s 2020 Survey and the Spending
2.13 below compares this information across the Potential Index for Entertainment & Recreation,
service areas. our team gathered information on Sports and
Leisure Market Potential. The information in
Consistency between median household Figure 2.15 illustrates participation rates for adults
income and household budget expenditures is in outdoor activities. This data shows that adults’
noteworthy. It also indicates that, compared to overall propensity to participate in activities
the national level, spending in Kansas City is less, exceeds the national index of 100 in 10 out of 23
but similar to the state level. This suggests the activities. Often, when a participation number is
potential affordability of programs and services at lower than the national average, primary factors
various recreation facilities. include a lack of facilities or an inability to pay for
services and programs.
Utilizing data from the 2018 and 2019 Consumer
Expenditure Surveys by the Bureau of Labor
Statistics, our team analyzed households’ overall
tendency to spend on recreation activities. This
data is presented in Figure 2.14. Once more,
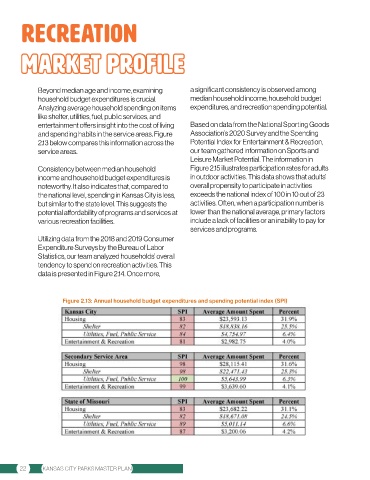
Figure 2.13: Annual household budget expenditures and spending potential index (SPI)
22 KANSAS CITY PARKS MASTER PLAN