
Page 24 - KCMO Parks Master Plan 2032
P. 24
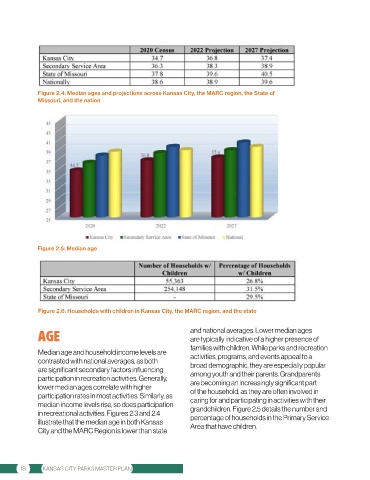
Figure 2.4: Median ages and projections across Kansas City, the MARC region, the State of
              Missouri, and the nation


             Figure 2.5: Median age


              Figure 2.6: Households with children in Kansas City, the MARC region, and the state


              AGE                                               and national averages. Lower median ages
                                                                are typically indicative of a higher presence of
                                                                families with children. While parks and recreation
              Median age and household income levels are        activities, programs, and events appeal to a
              contrasted with national averages, as both        broad demographic, they are especially popular
              are significant secondary factors influencing     among youth and their parents. Grandparents
              participation in recreation activities. Generally,
              lower median ages correlate with higher           are becoming an increasingly significant part
                                                                of the household, as they are often involved in
              participation rates in most activities. Similarly, as   caring for and participating in activities with their
              median income levels rise, so does participation   grandchildren. Figure 2.5 details the number and
              in recreational activities. Figures 2.3 and 2.4   percentage of households in the Primary Service
              illustrate that the median age in both Kansas
              City and the MARC Region is lower than state      Area that have children.


        18     KANSAS CITY PARKS MASTER PLAN