Page 25 - KCMO Parks Master Plan 2032
P. 25

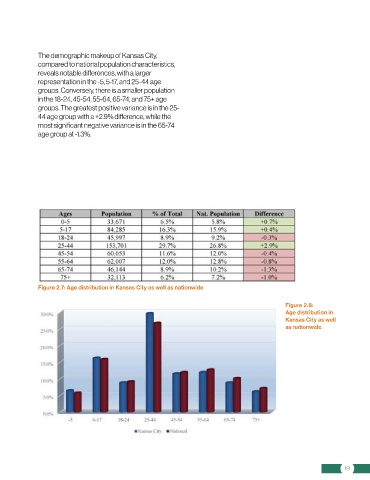
The demographic makeup of Kansas City,
              compared to national population characteristics,
              reveals notable differences, with a larger
              representation in the -5, 5-17, and 25-44 age
              groups. Conversely, there is a smaller population
              in the 18-24, 45-54, 55-64, 65-74, and 75+ age
              groups. The greatest positive variance is in the 25-
              44 age group with a +2.9% difference, while the
              most significant negative variance is in the 65-74
              age group at -1.3%.


              Figure 2.7: Age distribution in Kansas City as well as nationwide

                                                                                               Figure 2.8:
                                                                                               Age distribution in
                                                                                               Kansas City as well
                                                                                               as nationwide


                                                                                                                   19
   20   21   22   23   24   25   26   27   28   29   30