
Page 78 - KCMO Parks Master Plan 2032
P. 78
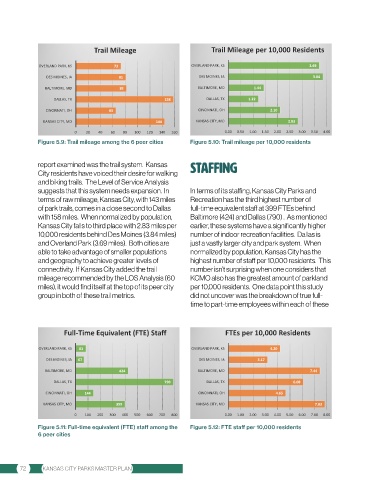
Trail Mileage                          Trail Mileage per 10,000 Residents


              OVERLAND PARK, KS        73                       OVERLAND PARK, KS                      3.69
                DES MOINES, IA          81                         DES MOINES, IA                        3.84

                BALTIMORE, MD            82                       BALTIMORE, MD      1.44
                   DALLAS, TX                          158           DALLAS, TX    1.22
                CINCINNATI, OH       65                            CINCINNATI, OH         2.10
               KANSAS CITY, MO                       144          KANSAS CITY, MO               2.83

                          0  20   40  60  80  100  120  140  160  180      0.00  0.50  1.00  1.50  2.00  2.50  3.00  3.50  4.00  4.50
              Figure 5.9: Trail mileage among the 6 peer cities  Figure 5.10: Trail mileage per 10,000 residents


              report examined was the trail system.  Kansas     staffing
              City residents have voiced their desire for walking
              and biking trails.  The Level of Service Analysis
              suggests that this system needs expansion.  In    In terms of its staffing, Kansas City Parks and
              terms of raw mileage, Kansas City, with 143 miles   Recreation has the third highest number of
              of park trails, comes in a close second to Dallas   full-time equivalent staff at 399 FTEs behind
              with 158 miles.  When normalized by population,   Baltimore (424) and Dallas (790) .  As mentioned
              Kansas City falls to third place with 2.83 miles per   earlier, these systems have a significantly higher
              10,000 residents behind Des Moines (3.84 miles)   number of indoor recreation facilities.  Dallas is
              and Overland Park (3.69 miles).  Both cities are   just a vastly larger city and park system.  When
              able to take advantage of smaller populations     normalized by population, Kansas City has the
              and geography to achieve greater levels of        highest number of staff per 10,000 residents.  This
              connectivity.  If Kansas City added the trail     number isn’t surprising when one considers that
              mileage recommended by the LOS Analysis (60       KCMO also has the greatest amount of parkland
              miles), it would find itself at the top of its peer city   per 10,000 residents.  One data point this study
              group in both of these trail metrics.             did not uncover was the breakdown of true full-
                                                                time to part-time employees within each of these


                      Full-Time Equivalent (FTE) Staff                      FTEs per 10,000 Residents

              OVERLAND PARK, KS  83                             OVERLAND PARK, KS         4.20

                DES MOINES, IA  67                                 DES MOINES, IA     3.17
                BALTIMORE, MD           424                       BALTIMORE, MD                         7.44
                   DALLAS, TX                          790           DALLAS, TX                   6.08
                CINCINNATI, OH  144                                CINCINNATI, OH           4.65

               KANSAS CITY, MO         399                        KANSAS CITY, MO                        7.83
                          0  100  200  300  400  500  600  700  800  900   0.00  1.00  2.00  3.00  4.00  5.00  6.00  7.00  8.00  9.00
              Figure 5.11: Full-time equivalent (FTE) staff among the   Figure 5.12: FTE staff per 10,000 residents
              6 peer cities


        72     KANSAS CITY PARKS MASTER PLAN