
Page 35 - KCMO Parks Master Plan 2032
P. 35
consultant team spent some time distilling
the comments based on City Council District
and found some trends. Residents in District
#1 expressed lots of appreciation for the
nature in their parks but also demanded
that trail segments be completed. District
#2 consistently raved about the miniature
railroad in Vaydik Park and begged for a dog
park. District #3 asked for more landscaping
in their parks as well as trash to be cleaned
up on greenways. District #4 expressed
concern about the homeless population and
also safety at trail and street intersections.
District #5 residents spoke of concern over
invasive exotic species and also the lack of
sidewalks in their neighborhoods. District #6
folks highly value natural spaces in their parks
and have a clear desire for more native plant
species.
ONLINE OPEN HOUSE
In M ay of 2023, KC Parks staff conducted
two virtual open houses. City staff utilized a
presentation that was developed for a series
of in-person open houses conducted in April.
Turnouf for both open houses consisted of
betrween 10 and 20 residents. The virtual
platform for community engagement can
provide more accessibility for diverse groups,
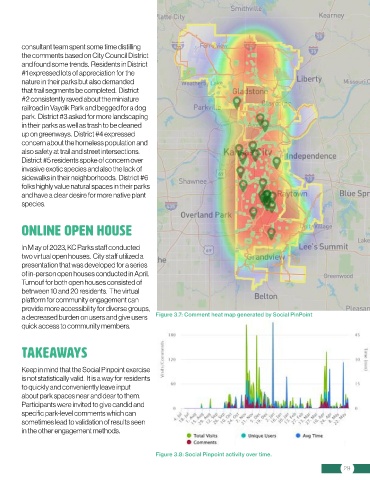
a decreased burden on users and give users Figure 3.7: Comment heat map generated by Social PinPoint
quick access to community members.
TAKEAWAYS
Keep in mind that the Social Pinpoint exercise
is not statistically valid. It is a way for residents
to quickly and conveniently leave input
about park spaces near and dear to them.
Participants were invited to give candid and
specific park-level comments which can
sometimes lead to validation of results seen
in the other engagement methods.
Figure 3.8: Social Pinpoint activity over time.
29