
Page 42 - KCMO Parks Master Plan 2032
P. 42
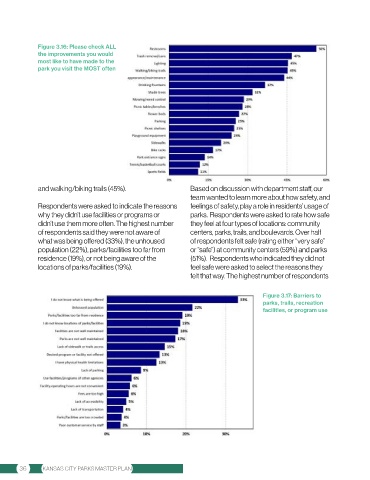
Figure 3.16: Please check ALL
              the improvements you would
              most like to have made to the
              park you visit the MOST often


              and walking/biking trails (45%).                  Based on discussion with department staff, our
                                                                team wanted to learn more about how safety, and
              Respondents were asked to indicate the reasons    feelings of safety, play a role in residents’ usage of
              why they didn’t use facilities or programs or     parks.  Respondents were asked to rate how safe
              didn’t use them more often. The highest number    they feel at four types of locations: community
              of respondents said they were not aware of        centers, parks, trails, and boulevards. Over half
              what was being offered (33%), the unhoused        of respondents felt safe (rating either “very safe”
              population (22%), parks/facilities too far from   or “safe”) at community centers (59%) and parks
              residence (19%), or not being aware of the        (51%).  Respondents who indicated they did not
              locations of parks/facilities (19%).              feel safe were asked to select the reasons they
                                                                felt that way. The highest number of respondents


                                                                                        Figure 3.17: Barriers to
                                                                                        parks, trails, recreation
                                                                                        facilities, or program use


        36     KANSAS CITY PARKS MASTER PLAN